Photometric measurements

For optical characterisation and evaluation, we offer the following services:

  • Measurement of luminous intensity distribution in far field
  • Determination of color distribution by measurement of angular resolved emission spectra
  • Measurement of luminance and luminance distribution (near field) at different angles

Colour distribution of lamps and luminaries

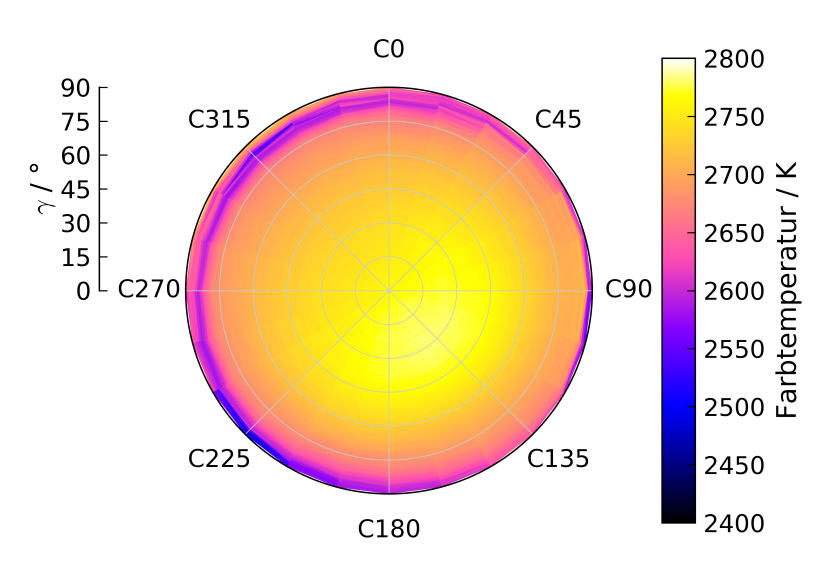
For the entire evaluation of a light source its luminosity distribution as well as its emission spectrum plays an important role. The emission spectrum determines how a light is perceived by humans: predominant emission in the blue spectral range leads to a »cold-white« colour impression. If reddish components dominate the spectrum, the light is perceived as »warm-white«. The colour impression is described by the so-called colour temperature which can be derived from the emission spectrum. Another parameter to describe the colour impression is the colour coordinate which can be determined in different colour coordinate systems. The oldest and best known system is the CIE colour space.

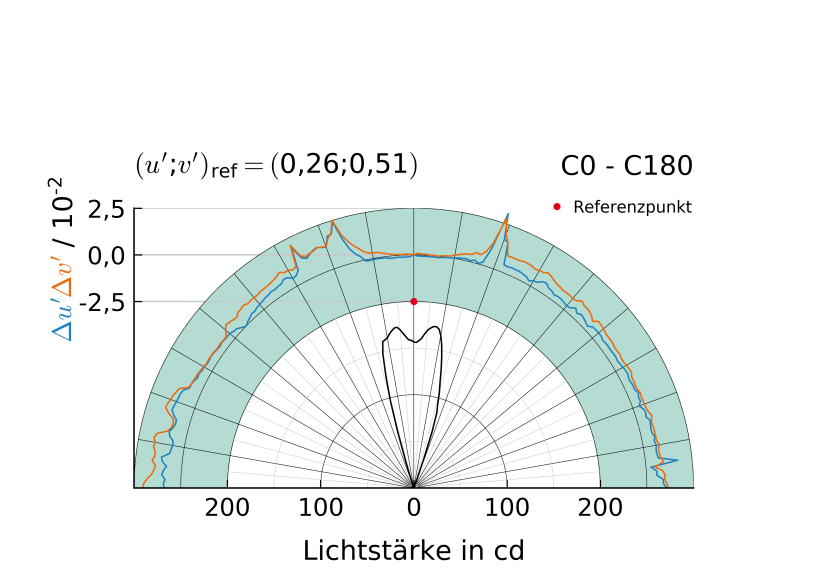
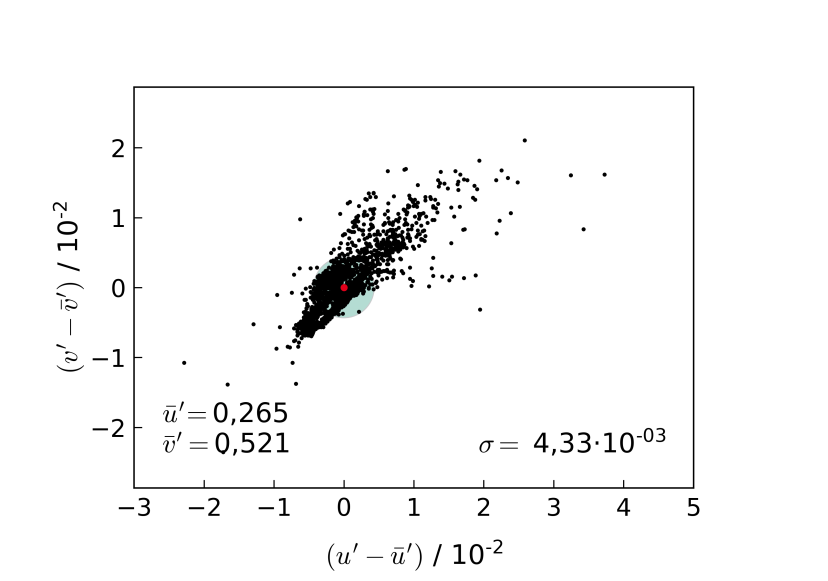
Due to the internal construction of a light source and/or the dispersion within the optical components disturbing colour fringes might occur. The latter ones can be described as an angular-dependent shift in colour coordinate within the CIE-LUV colour coordinate system.

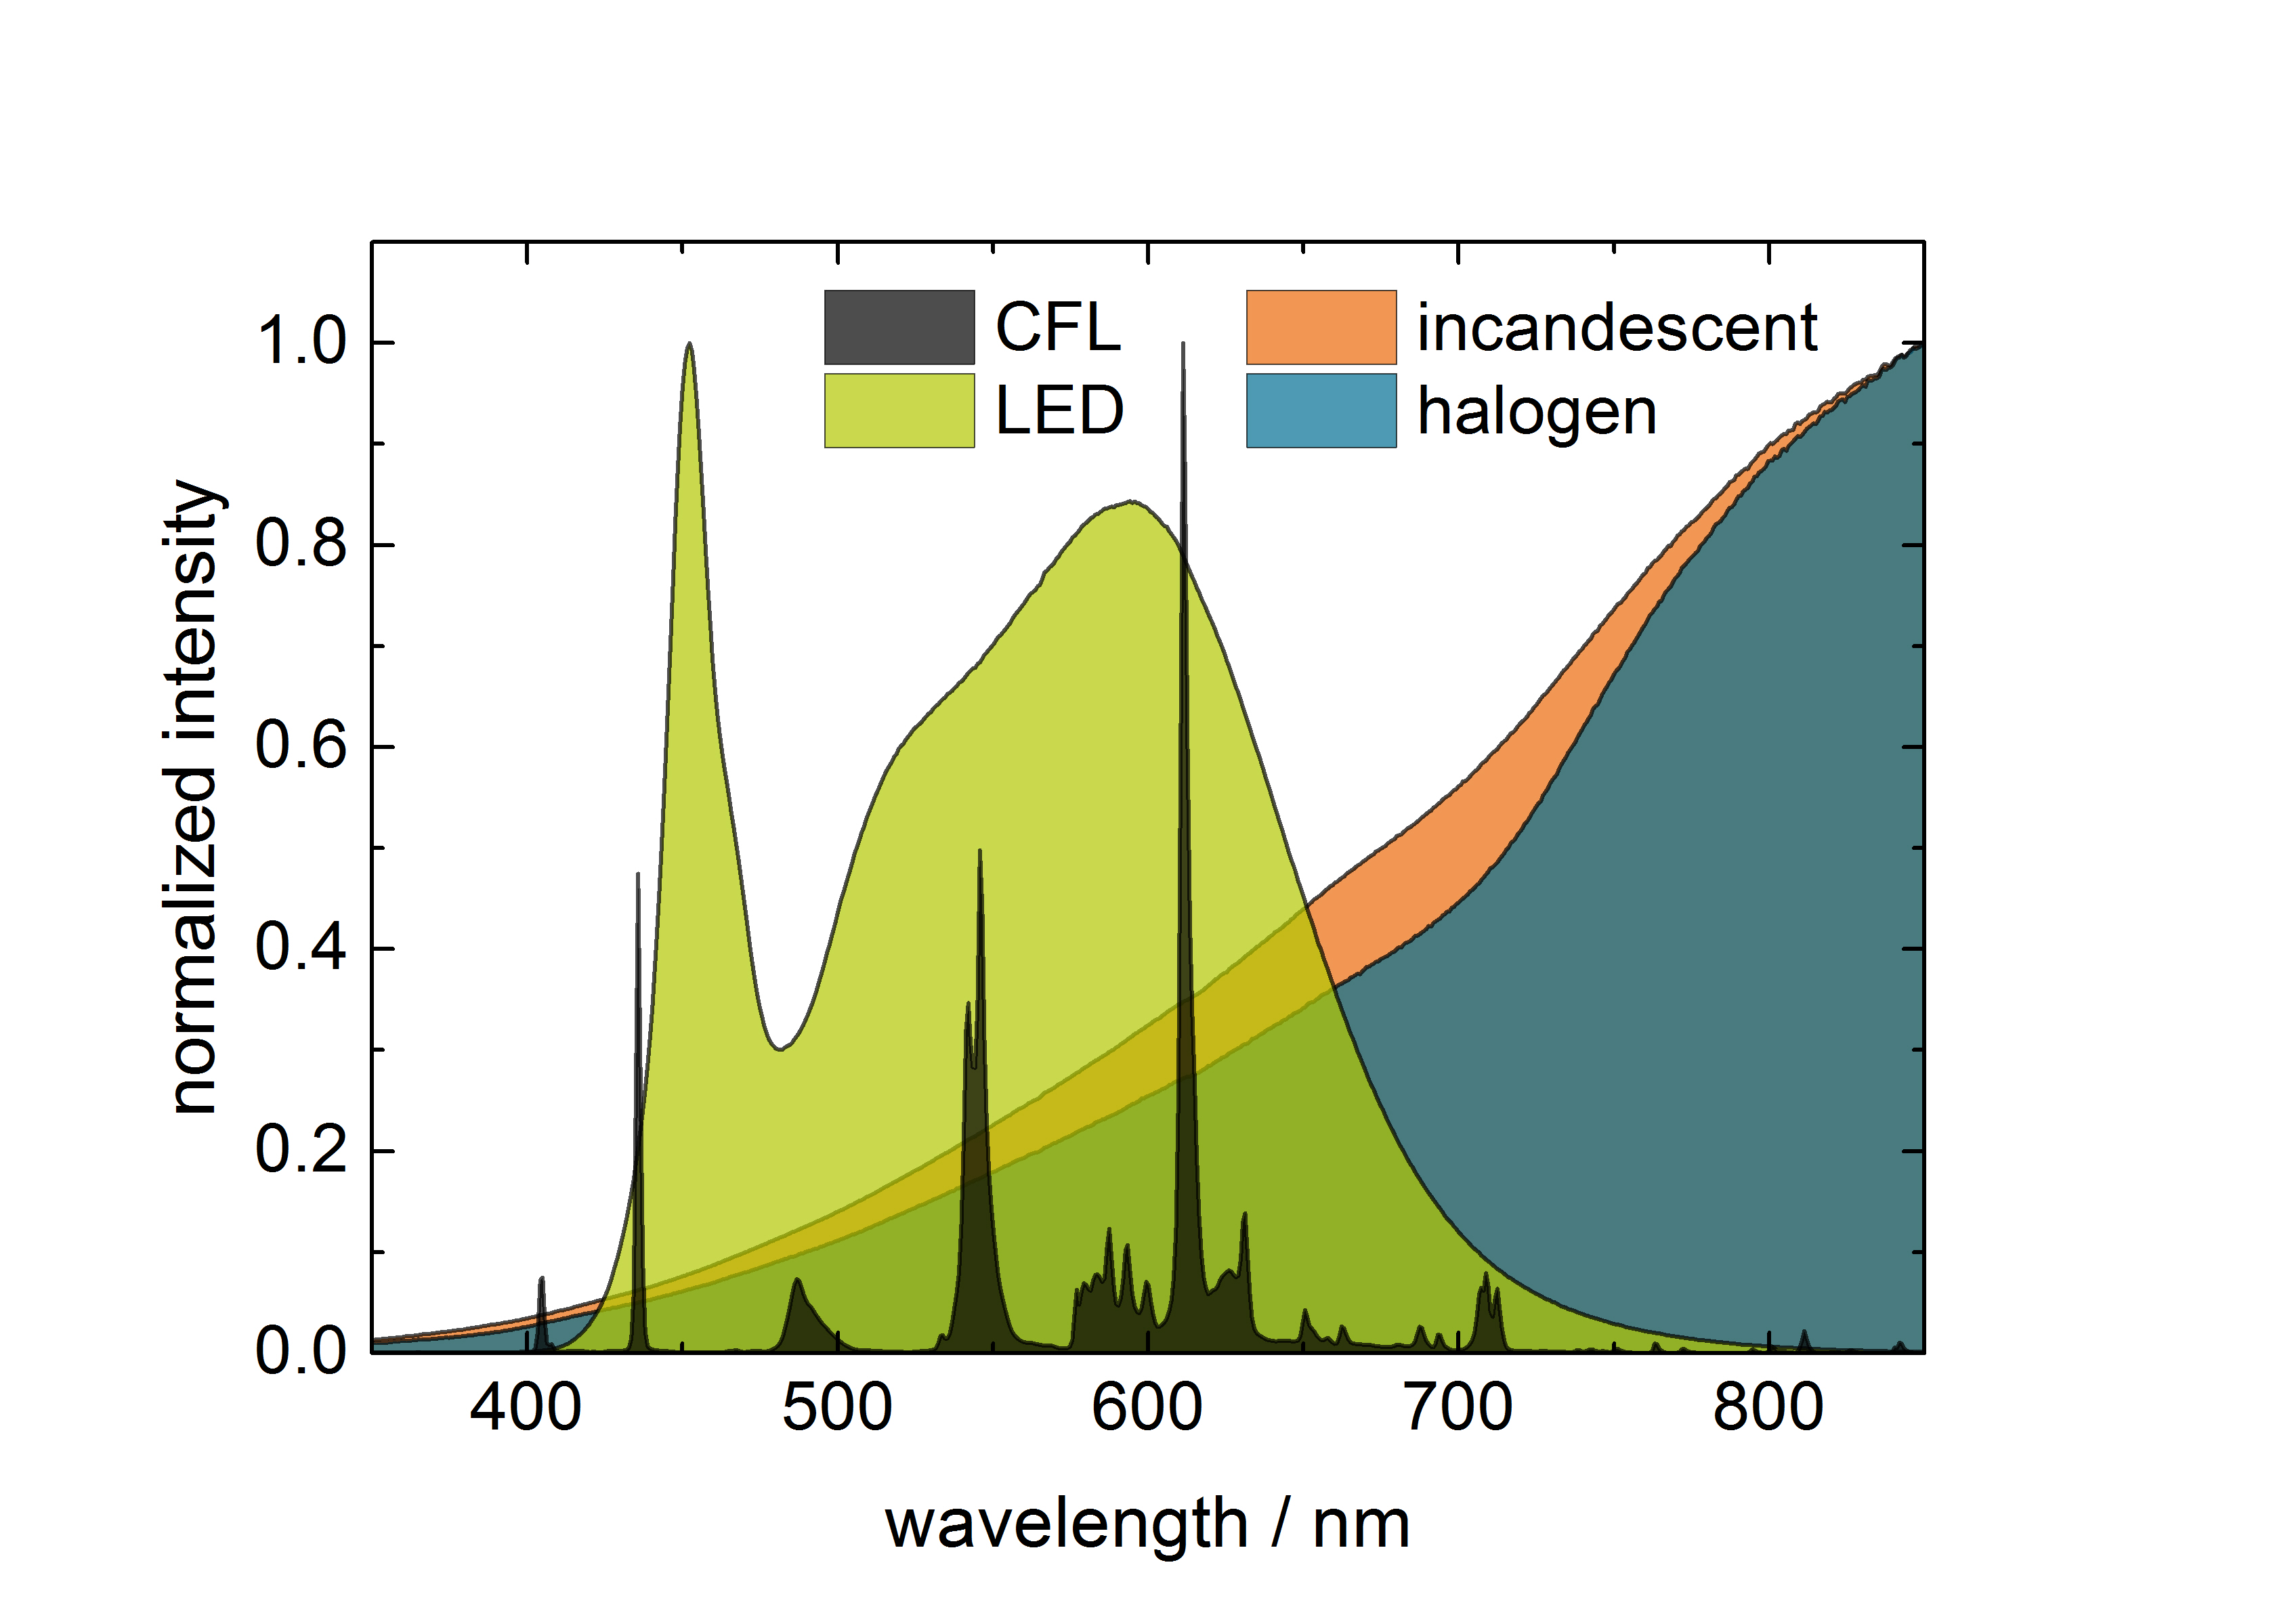
The emission characteristics of lamps and luminaries determine not only the colour impression of itself, but also how colours are perceived in the illuminated area. Light sources comprising a few narrow spectral lines (such as fluorescent lamps and energy savings lamps) lead to pale colours; light sources with a wide spectrum (like the sun, electric light bulbs or LEDs) allow a good colour rendering. A quantitative measure of the colour rendering quality is the colour rendering index (CRI = Colour Rendering index). This measure as well as others can be also calculated from the emission spectrum.

The spectrophotometer of the Fraunhofer Application Center for Inorganic Phosphors allows in combination with a goniometer system the measurement of the angularly-dependent emission characteristic of lamps and luminaries as well as the angularly-dependent colorimetric parameters.
Graphically depicted colour distribution of luminaires and light sources

© Fraunhofer AWZ Soest
Emission spectra of different illuminants.
© Fraunhofer AWZ Soest
Distribution of the cromaticity coordinate of a white light LED with an narrow beam optic.
© Fraunhofer AWZ Soest
Angular dependent cromaticity coordinate of a white light LED with an narrow beam optic.
© Fraunhofer AWZ Soest
Angular dependent color temperature of an usual white light LED.

Measurement of the luminance distribution

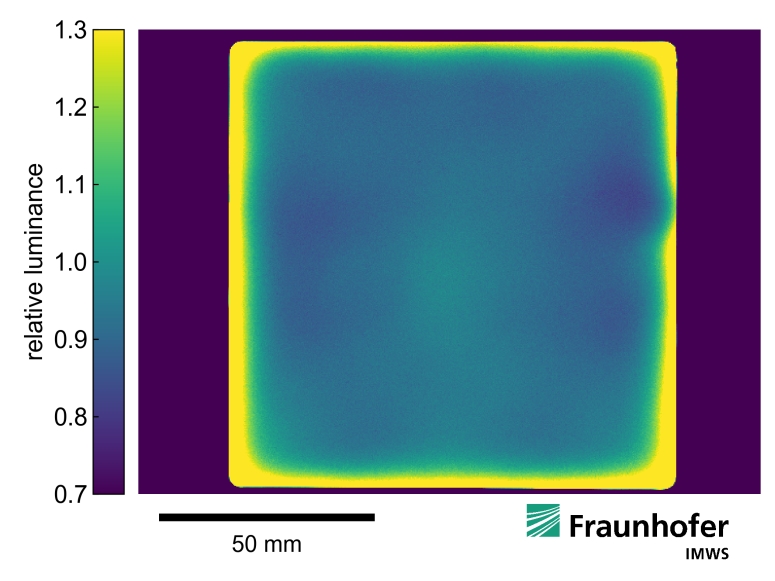
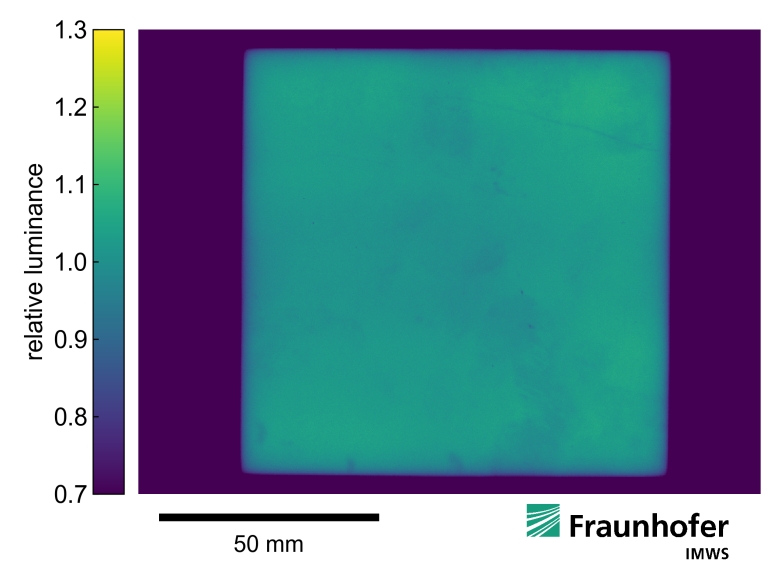
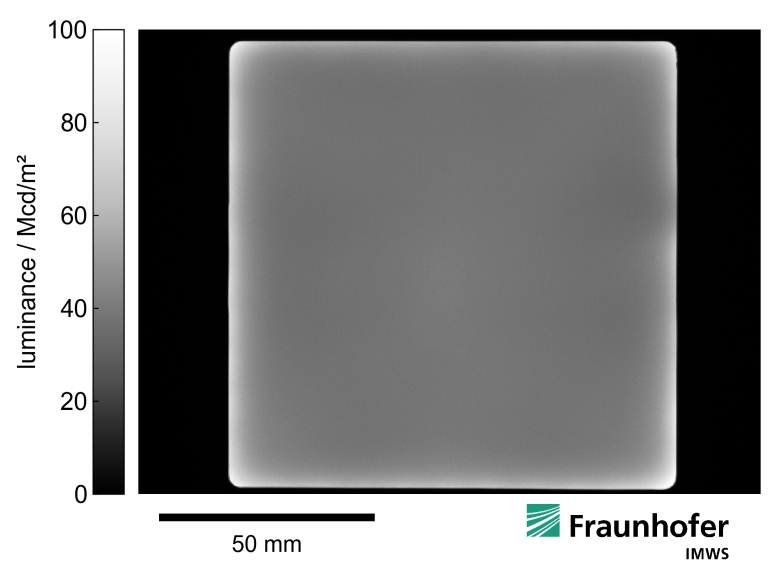
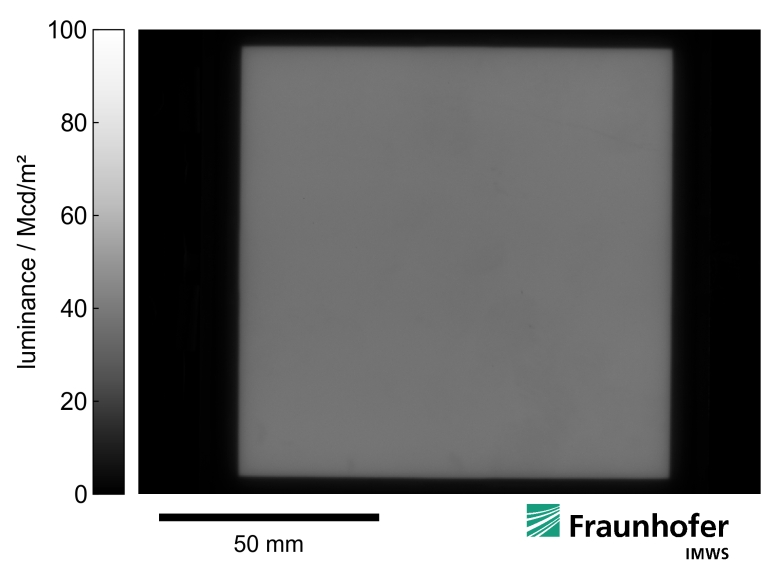
For flat light sources (such as LED and OLED panels, but also lamps and luminaries), the luminance describes the luminous intensity per surface which corresponds to the brightness impression of the viewer. The knowledge of the spatial luminance distribution matters to the evaluation of light sources with respect to the following: First, for flat light sources, the luminance distribution is an important quality criterion (here, a homogenous brightness is of particular importance). Secondly, a too high local luminance should be avoided to avoid glare.

The camera system of the Fraunhofer Application Center in Soest allows to measure the luminance in the upper half space of lamps and luminaries of the size of few mm² up to 34 x 25 cm².

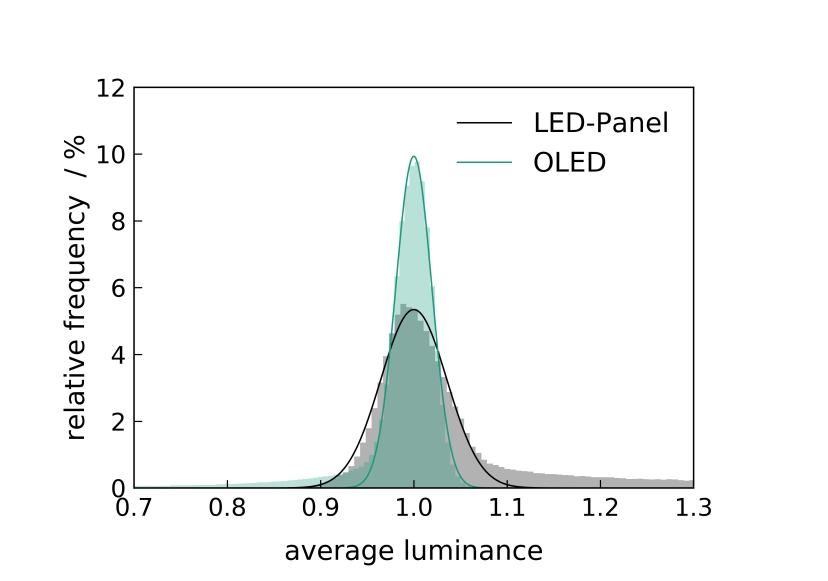
Luminance distribution: A comparison between LED and OLED

© Fraunhofer AWZ Soest
Luminance distribution of a LED panel with respect to the average luminance.
© Fraunhofer AWZ Soest
Luminance distribution of a OLED panel with respect to the average luminous density.
© Fraunhofer AWZ Soest
Histograms of the luminance distribution of a LED and an OLED panel, both with respect to the average luminance.
© Fraunhofer AWZ Soest
Luminance distribution of a LED panel.
© Fraunhofer AWZ Soest
Luminance distribution of an OLED panel.

Measurement of luminous intensity distribution by goniophotometry

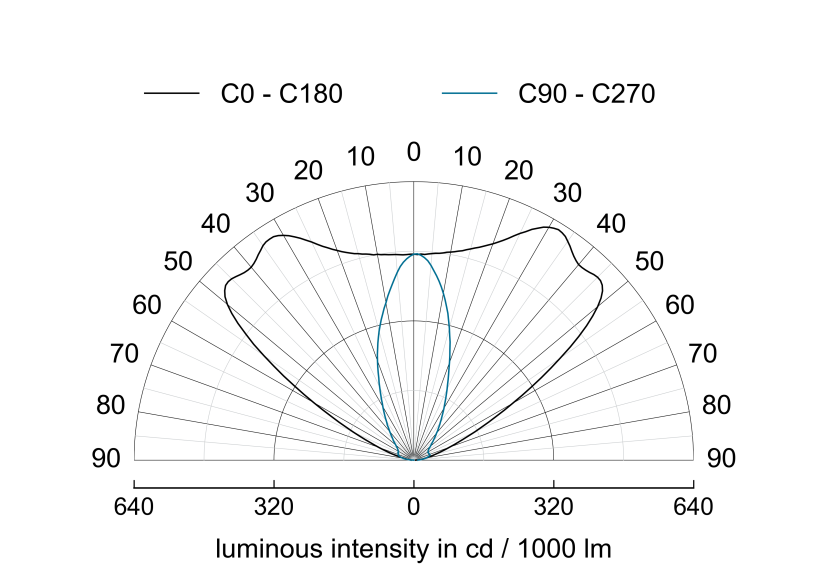
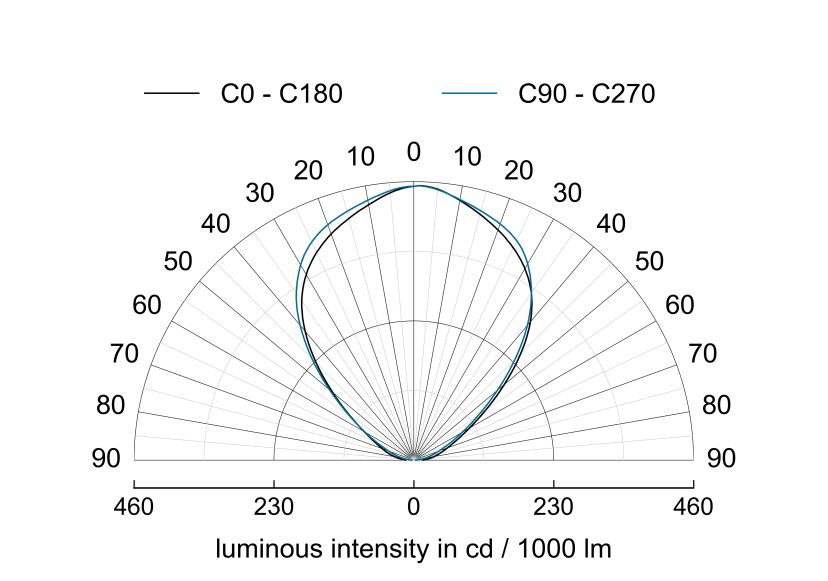
The luminous intensity distribution is an important measure to evaluate the directional emission characteristic of lamps and luminaries. It describes how much light is emitted by a (point-shaped) light source in a certain direction. The spectral sensitivity of the used detector corresponds to that of the human eye.

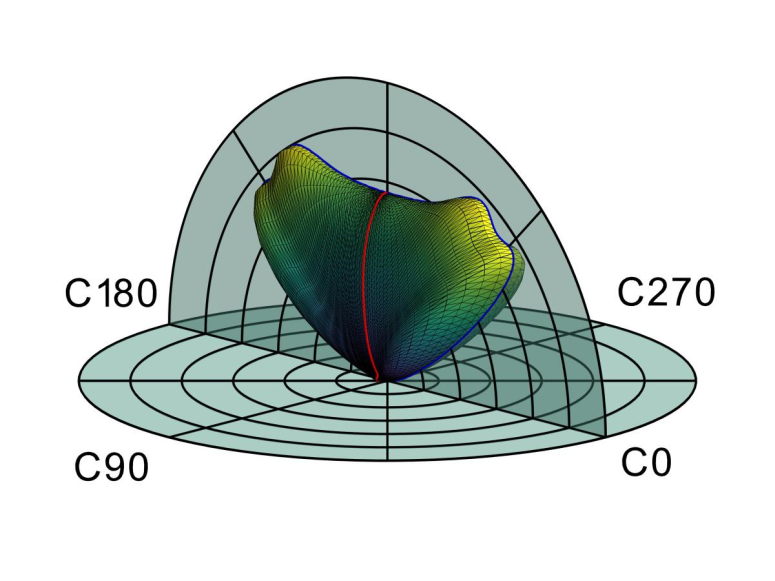
The 3D-representation illustrated above shows the flat luminous intensity distribution body of an optic for street lanterns. The directed light emission serves to illuminate exclusively the way.

The Fraunhofer Application Center for Inorganic Phosphors provides in its light lab a goniophotometer system, with which lamps and luminaries of the size of a single LED up to a maximum expansion of 80 cm can be measured. The obtained data are used, for example, by light planners and optical designers.

Luminous intensity distribution curves for analysis of angle dependent light emission

© Fraunhofer AWZ Soest
Luminous intensity distribution of an optic for street lanterns.
© Fraunhofer AWZ Soest
3D-representation of the luminous intensity distribution of an optic for street lanterns.
© Fraunhofer AWZ Soest
Luminous intensity distribution of a 3x11 LED optic from the OEM product line of BJB GmbH & Co. KG.
© Fraunhofer AWZ Soest
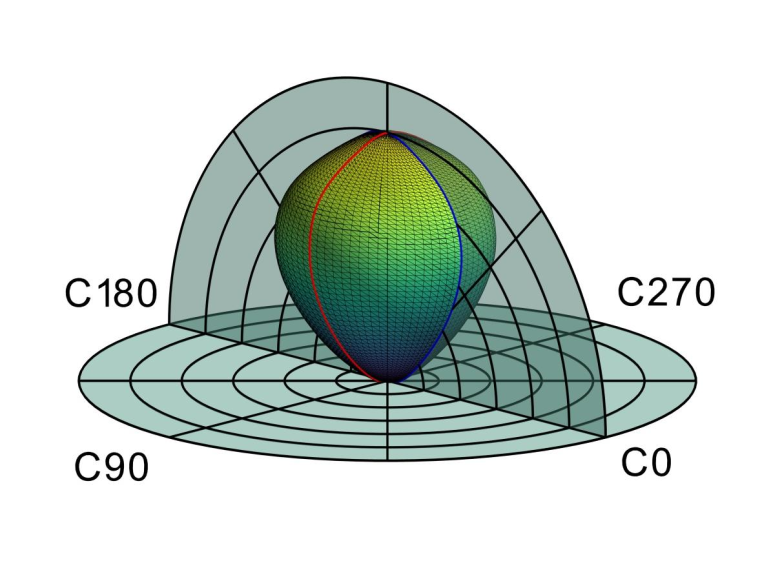
3D-representation of the luminous intensity distribution of a 3x11 LED optic from the OEM product line of BJB GmbH & Co. KG.